
TL:DR – How a safe cycling map for London by a lone wolf
- Aydin Crouch, 34, created the SafeCycleLDN map to improve cycling safety in London.
- The map, endorsed by the London Cycling Campaign, details safe routes across the city, covering all areas.
- It includes colour-coded lines for various cycling conditions, from protected lanes to shared spaces.
- SafeCycleLDN has over 1.3 million views, aiding novice and experienced cyclists alike.
- Despite infrastructure improvements, cycling remains risky, especially at junctions, with several accidents reported annually.
‘I spent 3000 hours making a London safe cycle map – 1,300,000 people use it’
Aydin is a hero in the two-wheeled circles and it all started when he wanted to help his flatmates who were scared of London’s roads.
Hairy junctions, tight corners and close shaves with buses – cycling in London can be a daunting prospect.
But one man is on a mission to change that and get people back on the capital’s roads.
Aydin Crouch, 34, set off on his bike five years ago to document which roads, paths and parks are safe to cycle in.
More than 3,000 hours later, he’s produced a map that’s got the thumbs up from the London Cycling Campaign – and you can check it out yourself.
Click the link to see the map on Google maps.
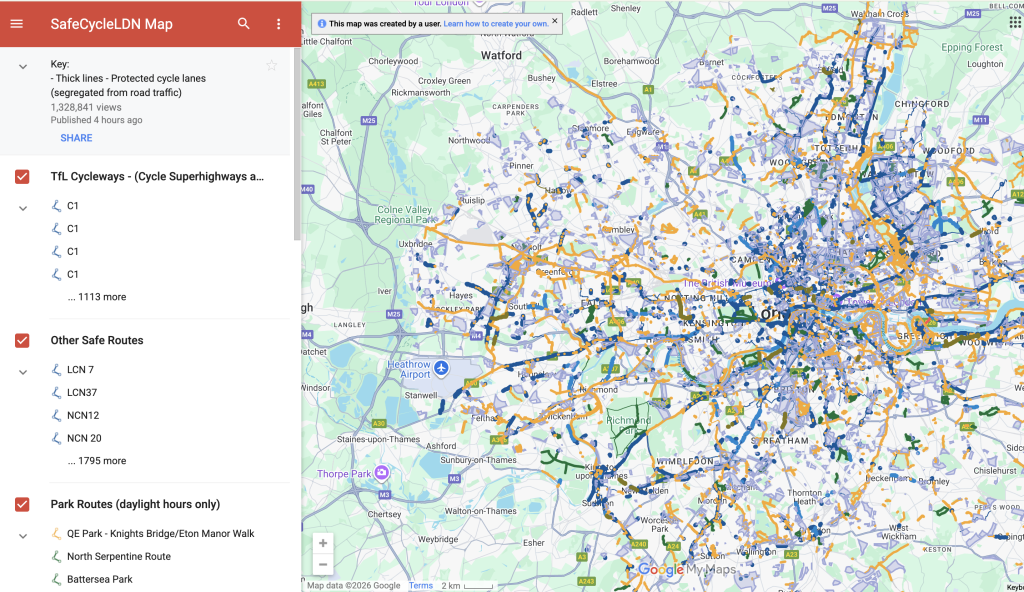
SafeCycleLDN Map explained
Thick blue lines: Protected permanent cycle lanes (segregated from road traffic)
Thin blue lines: Unprotected routes on quiet backstreets
Light blue: Light segregation from traffic (plastic bollards)
Orange lines: Shared space paths with pedestrians
Green lines: Shared space routes through parks that are closed at night
Blue boxes: Low-traffic Neighbourhoods
Brown lines: New routes under construction
Pink lines: New routes in consultation
It all started when Aydin’s flatmates told him they were ‘too scared to bike’ in London.
‘I told them I’d find a good cycle map for them, but I couldn’t find one,’ Aydin told WTX News.
‘So I started to create a map with a couple routes I knew and it just grew from there.
‘There needed to be a cycle map for London that made safety its focus.’
The heritage consultant spent hours on the road, as well as using Google Maps and tips from other enthusiasts to put the map – called SafeCycleLDN – together.
The result is a map which he says is far more comprehensive than Transport for London’s cycleways as it covers every inch of the city.
Aydin distinguished between permanent cycle lanes, paths that are loosely separated from cars, and roads that combine both bikers and vehicles.
Park routes are closures
The diagram also reveals which park routes are closed at night and which cycle lanes are being planned for the near future.
Aydin said: ‘It’s bloody hard to find your way around and like try and navigate a city this big.
‘Now if you’ve got this map, you can study your local area and find an established route that takes you wherever you’re going.
The cycling enthusiast’s map has been viewed over 1,300,000 times since 2021, but almost 1,000,000 users have used it in the past year alone.
The London Cycling Campaign, which advocates for safer cycling in the capital, has endorsed the map.
Simon Munk, head of campaigns and community development, told WTX News: ‘We absolutely love the SafeCycleLDN map – it’s a hugely useful resource for not just those planning routes across London but for active travel campaigners arguing for more safe cycle routes in their area.
‘We were heavily involved initially in the mapping, with our borough groups helping Aydin spot and check routes, Low Traffic Neighbourhoods, cycle tracks and more.
‘It’s absolutely brilliant he’s continued to develop the mapping beyond those heady early days and with London legends like Jon Stone from London Cycle Routes.
‘The SafeCycleLDN map means you can see clearly which London boroughs are delivering a safe cycling network, which are prioritising active travel and where the gaps are – because a joined-up cycle network is vital not just to save lives and reduce road danger but enable a far wider range of Londoners to cycle.’
How dangerous is cycling in London?
Despite investment in safer routes and roads in London, fears still remain about how safe cyclists are. The reality is TFL has created cycles lanes that cross junctions and offered no training to cyclists or to motorists.
These new junctions are a hazard and in some cases cyclist lights have appeared and most people don’t even notice them.
In 2024, almost 1,000 cyclists were seriously injured on London roads, while nine were killed.
An additional 3,800 people were injured more lightly while cycling in the capital.
Aydin said: ‘You might have a protected cycle route for part of the journey then suddenly you are left on your own.
‘It’s inconsistent. What we lack is that high-quality getting from A to B.
‘An average urban A road or B with quite a bit of traffic can be relatively dangerous, especially if it suddenly gets very narrow.
‘But it’s nowhere near as dangerous as junctions. That’s where most accidents happen. This is why TfL have their Safer Junctions programme.’
In 2024, The London Cycling Campaign used official data from TfL and the emergency services to create a ranking of the most dangerous junctions for cyclists.
Helping to protect cyclists
Aydin’s map is helping to protect cyclists little by little, he said.
He’s received numerous messages from novice cyclists saying his colour-coded routes have helped them get on the road.
Where his map has really taken off is among already dedicated cyclists, who tell him they’ve used it to find safe routes in areas they don’t know.
His hope is that a navigation app – such as Citymapper or Google Maps – work with him in the future to integrate his data into their systems.
Helen Cansick, TfL’s Head of Healthy Streets Investment, said: ‘TfL is committed to making cycling safer and more accessible for everyone in London.
‘We continue to work closely with London’s boroughs to deliver a high-quality and connected cycling network, and our London-wide strategic data supports the boroughs to deliver cycle routes in the places where people need them.
‘We have significantly expanded the cycleway network from 90km in 2016 to over 430km today and are investing further to continue enabling more people to choose cycling as a way to travel.
‘We continue to improve cycling infrastructure and support boroughs with funding and guidance to create safe and consistent designs across the capital.
‘We promote the network through localised campaigns, through our TfL Go app and by working with third-party app providers such as Google Maps to improve their routing algorithms and help Londoners plan their cycle journeys on the Cycleway network.
‘This work is part of our wider vision to make active travel in London an even more accessible and attractive option for everyone.’


This is a sample comment.